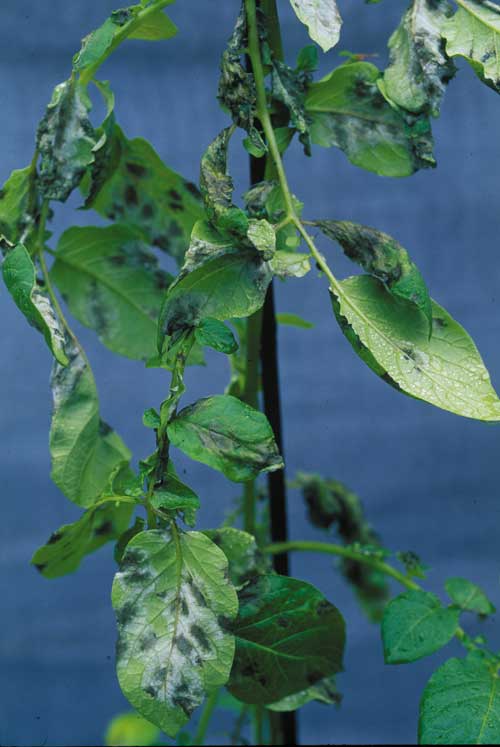
Late blight, known as one of the most serious constraints to potato production in developing countries, is also a weather-driven disease. For this reason it has been a major factor in the development of weather-based forecasting models that assist farmers in scheduling fungicide applications. The UC Davis Integrated Pest Management program, for example, maintains a catalogue of 16 late blight models. Over a decade ago, two of these forecasting models, SIMCAST (Fry et al., 1983) and BLIGHTCAST (Krause, 1975), were integrated by the International Potato Center (CIP) in a Geographic Information System (GIS) (Hijmans et al., 2000). This technology can be used for geographic zonation based on potential late blight severity, along with disease management questions, resource allocation, impact assessment, and exploring climate change scenarios. After some refinement, the procedure developed by Hijmans et al (2000) was labeled GEOSIMCAST and used to evaluate the effect of climate change on late blight severity in the highlands of Peru (Giraldo et al., 2010).

Late Blight
Process-based ecological models such as GEOSIMCAST that assess organisms’ responses to environmental conditions often need input data at a high temporal resolution, e.g., hourly or daily weather data. Such data may not be available for large areas at a high spatial resolution, limiting opportunities to use these models. To address this problem, a metamodeling framework was used to develop reduced forms of ecological models that require lower resolution input data than the original. For the case of late blight, a generalized additive model was used to create metamodels, which unlike GEOSIMCAST only require daily or monthly weather data, while their predictions maintained the key features of the original model (Sparks et al., 2011). This metamodeling approach can be applied to other complex models, allowing them to be used more widely.
Through the help of funding by the CGIAR Research Program on Climate Change, Agriculture and Food Security (CCAFS), the output of the metamodeling approach was made more readily accessible by creating overlays of late blight severity that can be used in GIS applications. Overlays for predicted late blight severity are currently available on the RTBMaps web page; and a more extensive list of scenarios is available for download as ascii files that can be easily viewed with desktop GIS applications such as QGIS, ARC and DIVA-GIS.
References:
– Fry WE, Apple AE, Bruhn JA, 1983. Evaluation of potato late blight forecasts modified to incorporate host resistance and fungicide weathering. Phytopathology 73, 1054–1059.
– Giraldo D, Juarez H, Perez WM, Trebejo I, Izarra W, Forbes G, 2010. [Severity of the potato late blight (Phytophthora infestans) in agricultural areas of Peru associated with climate change]. Severidad del tizon tardio de la papa (Phytophthora infestans) en zonas agricolas del Peru asociado con el cambio climatico. Revista Peruana Geo-Atmosferica, 56–67.
– Hijmans RJ, Forbes GA, Walker TS, 2000. Estimating the global severity of potato late blight with GIS-linked disease forecast models. Plant Pathology 49, 697–705.
– Krause RA, 1975. Blitecast: a computarized forecast of potato late blight. Plant Disease Reporter 59, 95–98.
– Sparks AH, Forbes GA, Hijmans RJ, Garrett KA, 2011. A metamodeling framework for extending the application domain of process-based ecological models. Ecosphere 2, art90.
