2.1 Theoretical Background and Requirements
Climate change will affect global and regional temperature increases differently (Govindasamy et al. 2003), and hence agro-ecosystems will be differentially vulnerable to pests under future climates. Further, temperature increases in already warmer tropical regions will increase insect abundance and activity proportionally more than in colder regions due to already higher metabolism rates of organisms (Dillon et al. 2010). Therefore, a science-based framework to assess and better understand climate change-induced pest risks on global, regional, and local scales is needed to better inform and increase the preparedness of stakeholders to potential changes, and so adapt pest management strategies in a timely manner. A framework for assessing climate change impacts on future pest risks must consider:
- The potential establishment of an insect pest in a new environment
- Its potential spread after an introduction
- Its potential economic impact in terms of pest abundance.
The Insect Life Cycle Modeling (ILCYM) software, developed by the International Potato Center (CIP), allows pest risk assessments to be conducted according to these criteria (Kroschel et al. 2013; Sporleder et al. 2013). It not only contributes to the pest risk analysis (PRA) framework as advocated by the International Plant Protection Convention (IPPC) (FAO 2007), but it also fills an important gap by providing detailed mapping information of pest risks in support of the International Standards for Phytosanitary Measures of the IPPC (IPCC 2014).
2.2 The ILCYM Software for Assessing Climate Impacts on Insect Pests and Associated Natural Enemies
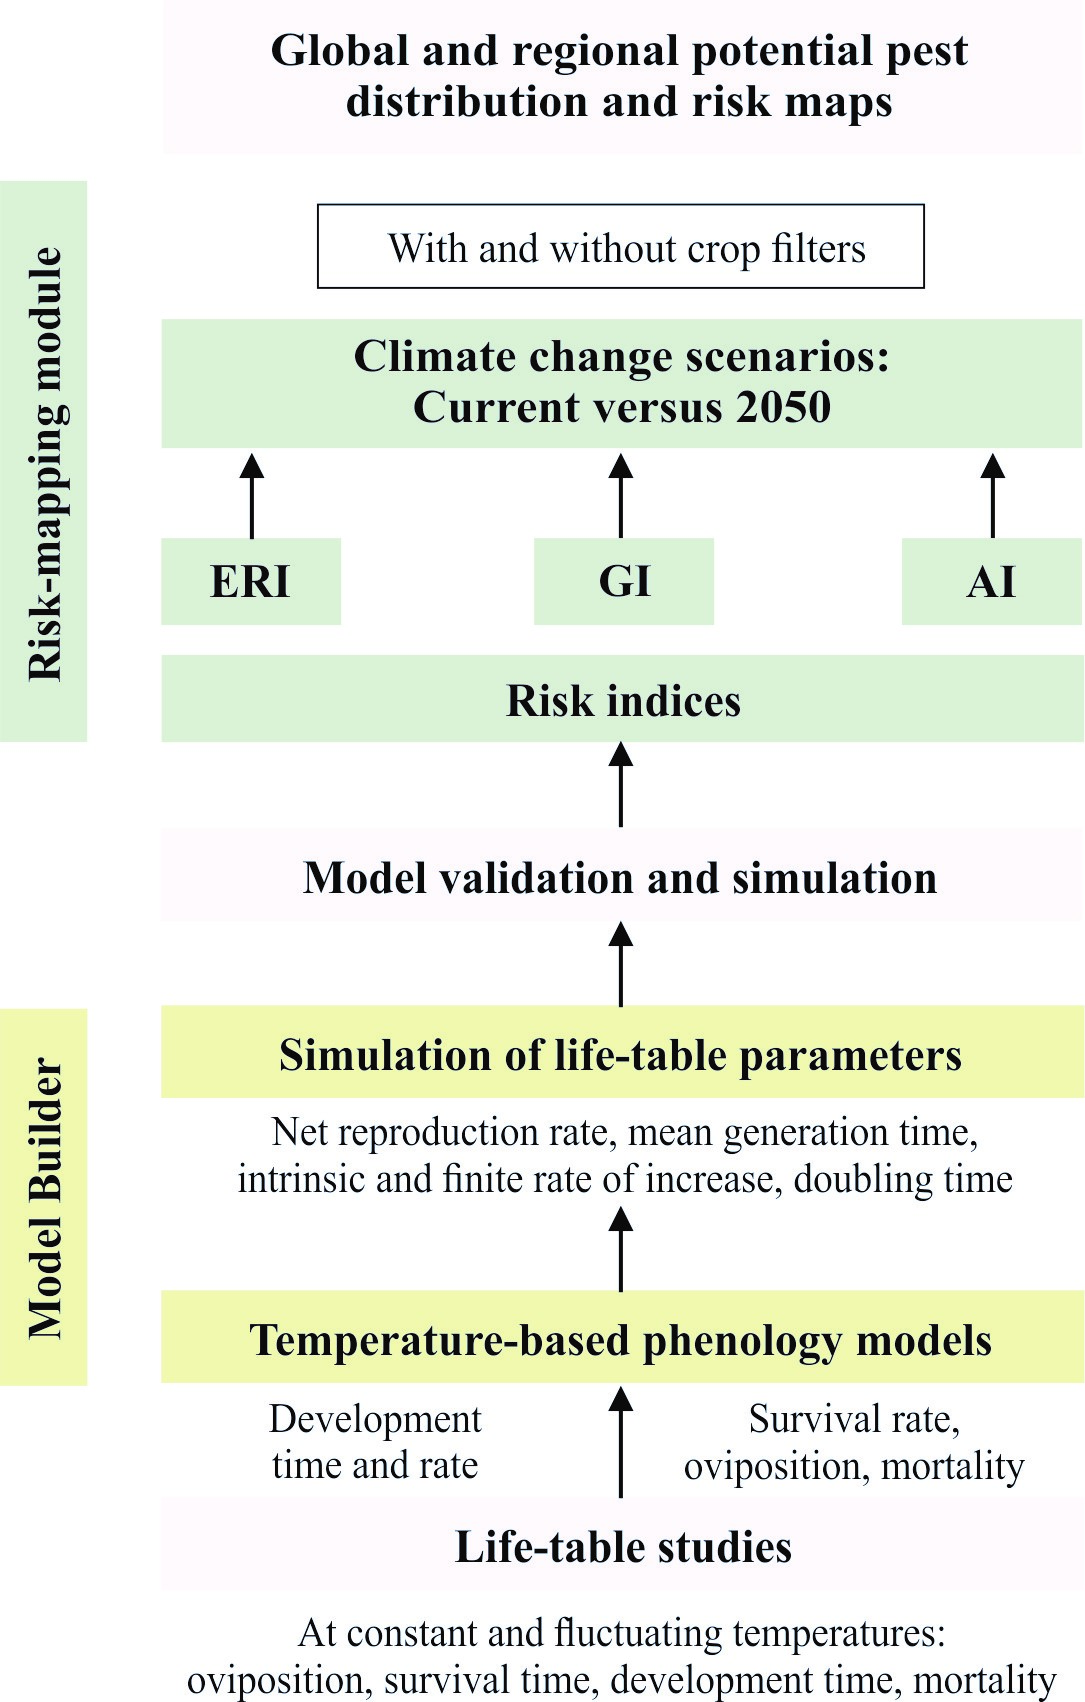
ILCYM is an open-source computer-aided tool built on R and Java codes and linked to uDig platform, which is a Geographic Information System (GIS), an application that contains basic tools for mapping and managing geographic information (Sporleder et al. 2013; Tonnang et al. 2013). The software package has been used to develop global, regional, and country pest risk maps as part of this risk atlas (see Fig. 1); it consists of three modules:
- The Model builder facilitates the development of insect phenology models based on life-table data derived from constant-temperature studies.
- The Validation and simulation module provides tools for validating the developed phenology model using insect life-tables established for fluctuating temperature conditions.
- The Potential population distribution and risk mapping module implements the phenology models in a GIS environment that allows for spatial—global or regional—simulations of species activities and risk mapping.
The relationship between aspects of insects’ life history (development, survival, and reproduction) and environmental variables (temperature) can be well described by process-based phenology models. The Model builder supports the establishment of process-based, temperature-driven and stage-specific phenology models. The analysis is based on empirical data (life-table or cohort studies) on the species generally collected in temperature-controlled experiments (see Annex 7.1). ILCYM’s Model builder contains a library of empirical linear and nonlinear models to define critical temperature requirements of insects’ life history.
Several statistical measures are provided for the estimation of parameters and the comparison and best selection of models. When all sub-models required to describe the insect’s life history are completed, the software automatically compiles an overall age-stage structured phenology model which is used, after the model is successfully validated, to simulate the pest’s performance in a given temperature regime. Outputs are life-table parameters that include net reproduction rate, gross reproduction rate, mean generation time, intrinsic rate of increase, finite rate of increase, and the doubling time, for a given temperature regime. Through these process-based analyses, the biology and temperature requirements of insects in general (pest, natural enemies, etc.) can be defined and the regions in which insects develop identified through GIS-simulation.
The Validation and simulation module is used to evaluate the ability of the developed phenology model to reproduce the insect species’ behavior under fluctuating, natural temperature conditions. This is achieved by comparing experimental life-table data obtained from fluctuating temperature studies (collected as described in Annex 7.1) with model outputs produced by using the same temperature records as input data. ILCYM stochastically simulates a user-defined number of life tables, each with a user-defined number of individuals, through rate summation and random determination for each individual’s survival, development to the next stage, and sex.
In the Potential population distribution and risk mapping module, based on the estimated life-table parameters, ILCYM calculates and maps three risk indices for assessing the potential establishment and population distribution, abundance, and spread of insect species (Box 1).
The phenology models and risk indices were simulated under current and future climate change scenarios for the year 2050. For spatial simulations under present climates, ILCYM uses temperature data obtained from WorldClim available at http://www.worldclim.org/. The database is a set of global climate layers (grids) with different spatial resolutions that contain monthly average minimum, maximum, and mean temperatures that were interpolated from historical temperature records worldwide (NOAA data) between 1950 and 2000. The data are well documented in Hijmans et al. (2005). For studying the effects of climate change on insects, the software provides downscaled future climate scenarios from different projections—for example, the SRES-A1B of the year 2050 (IPCC 2007), which was applied in all our presented studies included in the Pest Risk Atlas for Africa. The predictions based on the WorldClim database are described by Govindasamy et al. (2003). The downscaling of data conducted by Ramirez and Jarvis (2010) is freely accessible at http://gisweb.ciat.cgiar.org /GCMPage . Further, ILCYM provides several GIS functionalities for vector and raster analysis (e.g., to use shape files to map pest information only in those regions where target crops are grown). This has been applied to understand pest problems for specific crops (e.g., for the potato tuber moth, Phthorimaea operculella). Crop production data from the World Potato Atlas have been used as the potato tuber moth is a major pest in potato.
|
ILCYM also supports investigations to understand suitable release areas for natural pest enemies (e.g., parasitoids) and their potential efficiency to control pests in a given environment according to the prevailing temperature. Maps for natural enemies use the establishment index (EI): the higher the EI the higher the probability of successful naturalization. The potential number of generations indicates its control efficiency; the higher the AI the higher the probability of the species to spread in a region.