 Andean agro-ecosystems have been stated as being among the most vulnerable systems in the world, mainly because crop varieties in these areas are mostly landraces adapted to narrow environmental niches and because technology levels are rather low, compared to lowland systems. Beans and potatoes are probably the two most important crops in the Andes, partly because it’s the place where these crops originated and were domesticated, and partly because a large amount of rural population depends on those crops’ yields. Hence, adaptation to both progressive climate change and current climate risk are critical in these areas. Using the information of the AgTrials data repository for a set of key sites in the Andean region, I am exploring the feasibility of the application of two crop models (LINTUL-potato andCROPGRO-bean) over seasonal weather forecasts, to evaluate their accuracy and effectiveness for adaptation and to form the basis for improving models of agricultural production under current and future conditions.
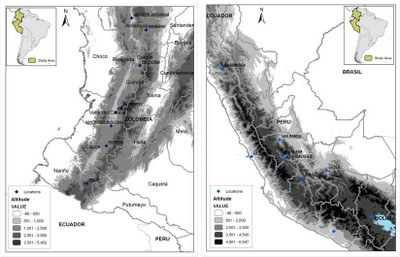
In a joint work with the International Center for Tropical Agriculture (CIAT), the International Potato Center (CIP), the Inter-American Institute for Global Change Research (IAI) and the Centro de Previsão de Tempo e Estudos Climáticos (CPTEC), a complete evaluation of the simulations of yield is being conducted in Peru for the potato crop, and in Colombia for the common bean (fig 1) with diverse data on seasonal climate originating from the ETA regional model (seasonal forecast version). I will take full advantage of the information from the experiments in AgTrials and the weather data available for (1) the calibration of the crop models, (2) the correction of systematic errors (bias) in the ETA model, and (3) the development of a method that allows to combine both, and to evaluate the precision and effectiveness of the predictions.
The initial step is a process of cleaning, and deleting to ensure the consistency of the data base of International Bean Yield Adaptation Nursery (IBYAN) existing in AgTrials, which allows the identification of problems such as: units, format, coding of variables, among others. The idea is to observe a little more thoroughly the standardization of the information of the data base, generating a template for in-field data collection that allows the integration of all the information adapted for AgTrials. Ideally the geneticists, physiologists and modellers would have participated in the compilation, capture, transmission and delivery of the information for the generation of the template. The template can be easily used by other members of the technical/scientific community, for example to share the available information in a standardized form with other users or institutions, and should include the protocols of data collection, the units of the variables in common formats, and a data dictionary, among others; it would be recommended to monitor the coding for each variable that is used in the field and for crop modeling.
Figure 1. Geographic location of study sites (blue dots) in Colombia (left) and Peru (right), and elevation (in meters) distribution across the Andean mountain chain.
Given the importance of environmental conditions for common beans and potatoes (variables that impact yield include temperature, precipitation, photoperiod, humidity, among others), as a second step we analyzed the quality of the weather data available in the data base for a daily time step applying statistical methods with the RCLIMDEX software (Sohrabi, 2009) for the quality control of weather data. Using RCLIMDEX the trends, possible jumps and seasonality were analyzed, which helped in the identification of extreme values (“outliers”) in daily temperature maxima and minima. Better results were obtained for the case of the temperature compared with precipitation. For the precipitation, additionally, the standardized precipitation index (SPI) was used to visualize the incidence and severity of wet periods and droughts, taking into consideration the growing period of common beans (90 days) and of potato in the Altiplano (180 days) (fig 2).
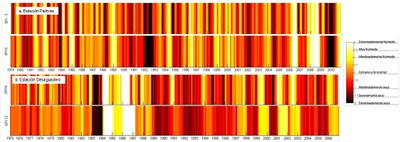
Figure 2. Spectrograms of the values of the Standardized Precipitation Index (SPI) at a scale of 3 (SPI-3) and 6 (SPI-6) months for the station of a. Palmira (Colombia) and, scale of 6 (SPI-6) and 12 (SPI-12) months b. Desaguadero (Peru).
After the quality control of both the crop and weather data, I am carrying out simulations with the crop models. The precision and quality of the preliminary results reflects the work carried out by the physiologist Jeffrey White in the parameterization of the common bean model in DSSAT (CROPGRO-BEAN), using as the one of its sources the IBYAN database. My next blog post will report on the results of the crop yield simulations with observed data and data from the ETA regional model.
Reference: Sohrabi MM, Marofi S, and Ababaei B (2009) Investigation of temperature and precipitation indices by using RClimDex and R software in Semnan province. International Conference on Water Resources, 16–18 August, pp 341–348.
About Diana Giraldo:
Diana joined CIP in 2008 as a research fellow working on her Master’s thesis entitled: “Zoning and risk assessment of potato late blight associated with climate change in agricultural areas of Peru.” A Colombian national, she is currently based in Brazil working at the collaborative CGIAR Challenge program on Climate Change, Agriculture and Food Security (CCAFS).